Avoidable Harm

I recently had a conversation on Twitter about a national campaign called ‘Sign up to Safety’, which aims to reduce avoidable harm in the NHS. Now, avoidable harm is clearly something worth tackling. The sticking point for me was that they have a numerical target to reduce avoidable harm by 50%.

What I can’t understand is why anyone would aim to reduce avoidable harm by 50% – if it’s avoidable, we should avoid it! Not just some of it. Why would you want to be ‘half-safe’?

It’s like deliberately planning to retain the other 50% of harm! Which, of course, sounds silly – because it is silly.

There’s a lot that’s silly (and harmful) about such targets, such as the assumption that a target is necessary to make people want to reduce harm in the first place. If they know that reducing harm is important (i.e. a priority), then the target is irrelevant. It might even be possible to measure some types of harm reduction, so that’s good too, because then you have measures to help you understand how your harm reduction efforts are going. The target is still irrelevant though.

Angry Stick Child

Anyway, why is the target 50%? How was this determined? Why not 55%, or 70%, or 81.648%? If it was set at 50% because it was deemed attainable, then what’s the point of the target, because you’re gonna attain it anyway, right?

Why is a 49.999% reduction a failure, whereas a 50.001% reduction a success? These invisible dividing lines between ‘good’ and ‘bad’ simply don’t exist in the real world. If you could reduce more harm than 50% then you would, wouldn’t you? If so, the target is irrelevant. If you wouldn’t, then why not?

How about if you reduced all the harm you possibly could, but this only amounted to 35% less harm? Have you failed? Why? What about if you had it within your gift to reduce harm by around 80-90%, but only reduced it by 55%? You’ve exceeded the target, but is this good?

Then there’s the stuff about method. How does a numerical target set at any level help you identify and address harm reduction opportunities? It doesn’t, because targets don’t provide a method.

Also, as I’ve said before, it’s better to aim for 100% (i.e. perfection) than just a fraction of your true goal. You’d then measure, learn and improve as you go along. Yes, in many domains (such as harm or crime reduction) it may not ultimately be possible to completely eradicate the object of your reduction efforts, but this shouldn’t stop anyone from trying.

Let me give you a few examples using the Stick People, to try and demonstrate why numerical targets like the 50% target for avoidable harm are pointless (not to mention arbitrary and prone to causing dysfunctional behaviour).

Here’s Stick Doctor. Today, Stick Doctor encountered two opportunities to reduce harm in her hospital. Guess how many she addressed? (Clue: It wasn’t one).
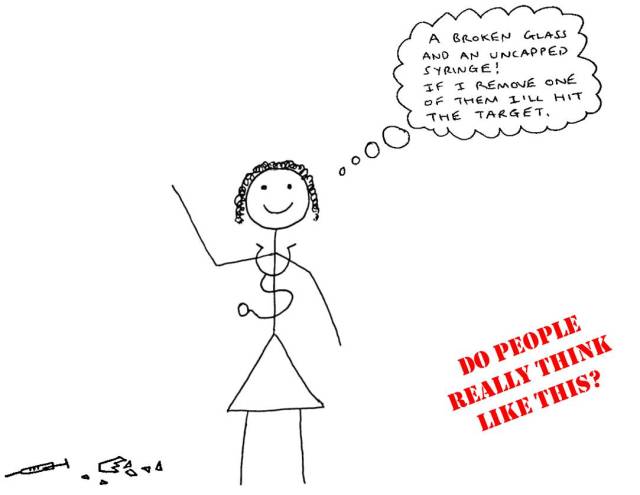
Stick Doctor Avoidable Harm

This is Stick Cop. Stick Cop currently has four investigations in his in-tray. He’s decided to investigate all of them to the best of his ability. Not just two.

Stick Cop - Avoidable Harm

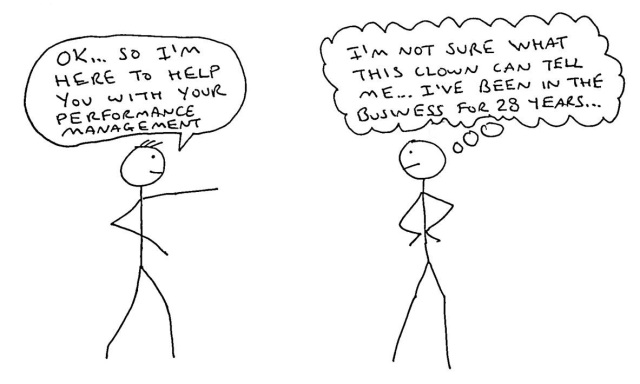
Here’s Stick Child. Stick Child saw one opportunity to help a group of under-10s get their heads around some basic performance management concepts. He didn’t stop half way through.

Stick Child - avoidable harm

Get  it now?

If you have a worthwhile priority, just focus on that. Measure your progress, using the right measures in the right way. Learn and improve. You don’t need the target.

Reduce avoidable harm by reducing numerical targets!

By 100%.

Posted in Systems thinking | Tagged , , , , , | 9 Comments

A Tale of Two Kings

Stick Child bedtime storyAt bedtime, Stick Child’s Daddy often reads his son a story from his favourite story book, “Medieval Stories from Stick Kingdom with an Inevitable Systems Thinking Moral”. One recent story they particularly enjoyed was called “A Tale of Two Kings”, which went a bit like this…

Once upon a time, many years ago, the King of Stick Kingdom decided to commission artwork to decorate his palace, so he secured the services of the greatest artist in the land – Stick Artist. He asked Stick Artist to paint him the most wonderful painting she could imagine. Stick Artist was up for the challenge and immediately fetched out her canvas, easel, brushes and paints.

Stick Artist 1

But then…just as Stick Artist was about to begin her masterpiece, Stick King said, “Oh, can you make sure you put some rhinos in the picture? I like rhinos”. Stick Artist said, “No problem, Stick King”, and began to paint.

Then Stick King stopped her again and said, “Oh, by the way, I really like the colour purple, so would you make sure there’s lots of purple in the picture?” “Okay, Stick King”, said Stick Artist.

After a few minutes, Stick King announced, “Oh, and I’d like the picture to be circular”. Stick Artist sighed quietly, doffed her beret, then began to cut her canvass into a circle.

This went on – spaceships, explosions, dinosaurs, zig-zags, mountains, more purple, hold the brush with your left hand, a little pink, some clouds, every third brush stroke to be 93.7 degrees adjacent to the previous one, and bananas. Stick Artist did as she was told, despite her mounting frustration (as she was the greatest artist in the land), until finally the picture was ready.

“Aggghhh – it’s an abomination!!” yelled the Stick King as the incoherent travesty of a painting was unveiled. “It’s a crime against art!” he raged.

Stick Artist 2

Stick Artist took the hint and ran away very quickly before she could be imprisoned. She thought it was a bit rich that the Stick King had blamed her for the mess that ensued after being so prescriptive with his daft ideas, especially as he wasn’t an artist himself.

Anyway, Stick Artist escaped to a neighbouring land, where the Stick Emperor soon heard of her reputation and commissioned her to paint him a painting for his palace. Stick Artist accepted the task, listened to Stick Emperor’s general ideas about what he wanted, then produced the greatest piece of art ever known in Stick Land.

Stick Artist 3

This merrie tayle goes to show that you get better results out of people who know their craft if you give them broad direction, rather than interfere and micromanage what they do. If only Stick King had been able to visit the future when this was more widely known.

Concepts like ‘Commander’s Intent’ (where a clear aim is communicated by a military leader, whilst affording flexibility and autonomy to subordinates to develop their own tactics) were unknown in medieval Stick Kingdoms. Notions such as workers being intrinsically motivated by a sense of autonomy, mastery and purpose were also unheard of by Stick Kings hundreds of years ago.

The good news for us today is that this stuff is known.


Posted in Systems thinking | Tagged , , , , | 2 Comments

Stick Child and The Fraggles

Fraggle rock and Stick Child

Recently, Stick Child was watching the television channel ‘Stick Gold’, when he came across an episode of the 1980s children’s show, Fraggle Rock. If you’re about the same age as Stick Child’s Daddy, you may well remember it too.

Fraggle Rock was inhabited by Fraggles; colourful, furry little creatures, who spent most of their time playing games and exploring their environment. Their favourite food was radishes, and if they touched their heads together before they went to sleep they could share their dreams with each other.

fraggle-rock-cast

Fraggle Rock was also inhabited by even smaller creatures called Doozers, who spent all of their time building constructions out of a radish-based substance, which the Fraggles liked to eat.

doozersThe Doozers actually wanted the Fraggles to eat their constructions so they could go on to build more. This was essentially the only interaction between Doozers and Fraggles; Doozers spent most of their time building, and Fraggles spent much of their time eating Doozer buildings. They thus form an odd sort of symbiosis.

This symbiosis was integral to the episode that Stick Child watched. Mokey (one of the Fraggles) called upon the Fraggles to stop eating the Doozers’ constructions – because they spent so much time making them. As a result, Fraggle Rock quickly filled with constructions, meaning the Doozers had no space left in which to build. After running out of space, the Doozers finally decided to try and find a new place to live as the Fraggles wouldn’t eat their constructions; there was even a tragic scene with a mother explaining to her daughter that Doozers must build or they will die.

Overhearing this, Mokey realised that she had inadvertently disrupted a vital symbiotic relationship through her well-intentioned, but ultimately misguided actions. As a result, she frantically rescinded her prohibition and encouraged the Fraggles to gorge on the structures – just in time to persuade the Doozers to stay.

Stick Child enjoyed the show, and even at the age of 9, recognised that there were parallels with real life. Sometimes managers make decisions, introduce new policies, initiate activity, or change systems conditions without first understanding the system, or the fact that their actions may cause unintended and unwanted side effects. This can happen even when they act with good intentions.

As Deming said, “We are being ruined by best efforts”.

Therefore, it’s important to recognise that best efforts and good intentions can destabilise symbiotic relationships necessary for the survival of the system. So… take a leaf out of the Fraggles’ book and heed the wise words of Gobo, Fraggle Rock’s resident systems thinker:*

Gobo fraggle quote

* Okay, so I made that up.

Posted in Systems thinking | Tagged , , , , | Leave a comment

Top of the Table

When the Chair of the House of Commons Education Committee asked Michael Gove (Secretary of State of Education at the time) about comparative performance measurement between schools, this happened:

Chair: If “good” requires pupil performance to exceed the national average, and if all schools must be good, how is this mathematically possible?

Michael Gove: By getting better all the time.

(Full transcript here)

Now, sniggers to one side, there’s a few important points here. The first is that I don’t disagree with striving to get better all the time; neither do I think performance shouldn’t be measured. I also believe it can be useful to understand apparent differences in comparative peer performance.

So, what’s the problem?

Well, it’s the way it’s so often done – league tables.

Here’s an example using police forces, although you could replace them with schools, hospitals or other institutions, if you like.

Stick Child top of the table 1

League tables are over-simplified, misleading, fundamentally illegitimate, charlatans of the performance world; they purport to convey information about comparative peer performance, when in fact they are little more than mirages. They lie to you. They tell you stuff that isn’t there. They set you off on thought processes and assumptions that are utterly unwarranted. (A bit like slightly more elaborate binary comparisons. Ugh!) But the most dangerous thing about them is that they appear so plausible.

A notable problem with league tables is that they are routinely methodologically unsound and notoriously unstable. (This is particularly true of league tables constructed from complex public sector data). Due to statistical considerations I won’t inflict on you here, it is often mathematically impossible to neatly rank institutions in the tidy fashion we are so used to (i.e. one at the top, one at the bottom, and the remainder nicely stacked in between, from best to worst). You see, in league table world, about half of those ranked end up as ‘below average’, and someone is always bottom. So not everyone can be above the national average! Why not? Because it’s an average.

What we should be doing is trying to establish if there are significant differences between peers, and this can be done very simply in a couple of ways, as demonstrated by Stick Child…

Stick Child top of the table 2

In this first example, the six police forces we saw earlier are assessed against each other, taking into account confidence intervals in the data. (Don’t worry if you’re unfamiliar with the term, just trust me that it’s important). As you can see, this tells us that two forces are performing significantly differently to the other four (i.e. there are no overlaps between the two groups). We can’t, however, neatly rank them from ‘best’ to ‘worst’, because we can’t separate the ‘top’ two from each other, and we can’t separate the other four from each other.

Here’s another way of understanding comparative peer performance in a more contextualised manner:

Stick Child top of the table 3

This time we can observe that the six police forces are all within the boundaries of ‘normality’ (by applying Statistical Process Control methodology). If any of them were outside of the dashed lines we might be concerned that particular force was significantly different from its peers; however, in this case, all six forces are clustered around the mean average (solid horizontal line) and within the range of anticipated performance for the group.

Therefore, there is absolutely no way the forces should be placed in ranked order – they are likely to move positions each time a snapshot is taken because of normal variation, but as long as they stay within the lines (and ideally, improve as a group), it is wrong to judge performance based on apparent position.

You see, when this happens, we encounter the other big problem associated with the league table mindset – concern about someone’s position in a league table leads to unfair assumptions about performance, unnecessary ‘remedial’ activity to address the perceived deficiencies, pressure from management, sanctions, and so on. And all based on something that essentially isn’t there. Cue gaming and dysfunctional behaviour! Like clockwork.

And a final thought – if league tables are constructed using crime data, are we even measuring the right thing? See this.

Posted in Systems thinking | Tagged , , , , | 3 Comments

It’s Criminal

Stick farmer

I’ve been meaning to get around to writing about the issue of using crime figures as an indicator of police performance for a while now. Aside from the risk of mis-recording crime due to target-driven performance management, I believe there is a fundamental argument against judging police performance by using crime figures. It boils down to this:

Crime rates are not the definer of effective police performance; they merely provide information about criminal activity.

What do I mean by this?

Well, we’ve been so used to judging police performance based on whether crime is higher or lower than some previous point in the past (binary comparisons), positions in league tables, or variance from arbitrary numerical targets, that it’s easy to miss the obvious question about whether we’re measuring the right thing in the first place. Even when crime trends are shown in time series format (e.g. control charts), I’d argue that it’s still a case of measuring the wrong things (albeit in the ‘right’ way) if the intention is to assess police performance.

Try these analogies:

  • Judging a vehicle repair agency (such as the AA) by the number of breakdowns reported.
  • Judging a heart surgeon’s performance by the rate of heart disease cases in a locality.
  • Judging the fire service’s performance by the number of car fires.
  • Judging Stick Farmer’s performance by the number of lambs born each spring.

(One of these measures is actually real, silly though this may sound).

I’m not saying these datasets are useless for helping these people understand their business (they’d certainly be useful for understanding demand and maybe assisting future planning), but they are not measures of performance. In the policing context, yes of course we want to reduce crime (Peel talked about it, didn’t he?) and we should take reasonable steps to prevent it, but we need to move beyond the simplistic narrative of:

“Crime up = Police bad / Crime down = Police good”.

It’s also necessary to acknowledge that multiple variables affect crime rates; factors such as economic cycles, substance abuse, the weather, societal influences, changes in legislation, and so on. None of these are directly within the gift of the police to influence. Also, what about where the police cause an increase in reported crime by having the temerity to find someone carrying a weapon? Surely proactive problem-solving should not be discouraged on the basis that finding hitherto unreported criminal offences is incongruous with an over-simplified crime reduction narrative.

Stick Burglar

At the local level, if Stick Burglar is arrested and jailed, and burglaries suddenly stop, it’s probably fair to assume that the police directly affected that particular crime series. Conversely, at force or national levels, if crime happens to go up or down a bit, it’s likely to be as a result of the plethora of external factors that influence the crime rate (as well as normal variation).

It’s time for a shift in thinking about crime rates and police performance. By removing perverse incentives for mis-recording crime, we are hopefully left with a clearer picture of criminal activity. Such data can then act as extremely useful sources of information that assist decision making about how best to tackle reported crime.

But it’s not ‘performance’ data.

In the same way, the AA should not be held accountable for a vehicle breaking down; neither should the fire service be blamed if an electrical fault causes it to catch fire. There may be opportunities to learn about causes and respond to future patterns of demand (where it’s predictable), but that’s all.

Therefore, it doesn’t seem logical to directly equate police effectiveness with crime levels, especially as the true extent of crime is unknown, and what is known is affected by a multitude of factors.

Reported crime, from whatever source, is potentially useful information about criminal activity.

Not performance data.

Posted in Systems thinking | Tagged , , , , , , | 15 Comments

Find The Treasure

“It’s just the starting point for asking questions”.

Binary comparison table

That’s what I often hear people say about this sort of thing. (Look at all the pretty colours).

Well, it’s not. And the questions are usually the wrong questions, asked of the wrong people, leading to the wrong answers about the wrong things, causing us to look in the wrong places for stuff that isn’t there, whilst missing the right things.

It’s a bit like this – let’s say Stick Child goes on a treasure hunt. He has the choice of three maps. Here’s the first one…

Stick Child map 1

This blank map is the equivalent of having no performance data at all.

The next map looks like this…

Stick Child map 2

This looks more like it doesn’t it? Well…no. Fortunately Stick Child is a bright little button and he knows the map was constructed by looking at last year’s map then guessing where the treasure is buried. This is pretty much the same as the binary comparison table.

Not wanting to waste his time digging in the wrong places, Stick Child opts for Map 3, which has been drawn using accurate information and presented in a format that will help him track down the treasure with ease. Here it is…

Stick Child map 3

So there you go. Right measures, measured right, once again. If you’re wondering why binary comparisons keep getting slapped down, refresh your memory with this and other previous blogs. It’s a similar message to the last one with the guns, but I had to keep Stick Child away from them, otherwise something like this would have happened…

Stick Child cowboy

(Artwork by my Dad).

He’s off to do some target shooting of course. 😉


Posted in Systems thinking | Tagged , , , , , , , , | Leave a comment

The Real Thing

Have a look at these three handguns… (Glock 17s to be precise):

Glocks

  • One is real.
  • One fires plastic balls.
  • One fires blanks.

Which is which though? Can you tell which is the real one?

Even upon handling them in real life, it would take someone who knows what they’re doing to establish which is which. But then imagine if you had any of the above pointed at you in a dark street. It’s practically impossible to make a snap judgment about which is real in the heat of the moment. I wouldn’t wish that decision on anybody.

That’s because all of these Glocks have the appearance of being the real thing. The same applies to performance management tools. Binary comparisons, league tables and numerical targets look and feel like the real thing, but they’re not. They’re the imitation firearms of the performance world.

Unlike the Glocks however, when someone points a binary comparison at you it’s unlikely that you need to react immediately. Look closer to see if it really is what it appears to be – a credible piece of performance information – and once you’ve identified it fires blanks, simply disregard it in favour of the real thing. (You should know what that is by now!)

Don’t shoot yourself in the foot.

Posted in Systems thinking | Tagged , , , , , | 2 Comments

Stick Child’s Kitchen Nightmares

One evening Stick Child was awake a bit later than usual and saw part of a programme about a TV chef who goes into failing restaurants and helps them get back on track. Being as Stick Child is only 9 years old, his Daddy quickly changed channels as the TV chef launched into a tirade consisting of language so colourful it would have made Stick Caligula blush.

Anyway, that night Stick Child had a dream that went a bit like this….

Stick Child chef 1

Stick Chef began to take a look around…

Stick child chef 2

He didn’t like what he saw.

And it got worse…

Stick child chef 3

A violent rage began to erupt from within his stick body…

Stick child chef 4

Stick Chef’s meltdown continued…

Stick child chef 5

Then he had a moment of calm…

Stick child chef 6

The other guy thought this sounded vaguely familiar, but listened anyway. Then things got even better…

Stick child chef 7

The dysfunctional practices were no more and Stick Chef’s work was done.

Stick child chef 8

Then Stick Child woke up and smiled.

Stick child chef 9


Posted in Systems thinking | Tagged , , , , , , , , | Leave a comment

Method in the Madness?

Deming was fond of saying, “By what method?”

In other words, if you want to see performance improvements you need to have an actual method for achieving them. This means understanding the system and improving system conditions to help the workers deliver excellent performance. As we saw in the previous blog, no amount of inspirational leadership (or sheer hard work) can achieve this if system conditions constrain the workforce.

Taking the example of response times for the emergency services, let’s see how this concept works. In my experience, people who drive vehicles with blue lights and sirens usually already want to get to emergencies quickly; I’ve never known police response drivers deliberately drive slowly to a burglary in progress. Having a workforce that’s naturally aligned to organisational purpose means there’s one less hurdle to overcome when seeking performance improvements.

Stick police car

Next, you have to understand which systems conditions affect response times. There will be some that you can influence (e.g. amount of resources available, location of deployment bases, number of trained drivers) and some you can’t (e.g. road network, traffic conditions, weather). You would use this information in conjunction with data about the type and frequency of demand, then consider data relating to current response times, in order to establish the range of predictable performance and identify where opportunities for improvement lie.

Therefore, unless we assume frontline workers are bad and lazy, it should be obvious that the way to improve response times is to use our data / information about current performance to inform evidence-based decisions about how to improve the system. Actual methods could include boosting resources in a particular location in response to predictable demand, deploying differently, creating capacity by ‘switching off’ inappropriate demand, or something else. But you always need an actual method.

Which brings us to response time targets. Putting aside the arguments that numerical targets are arbitrary and prone to causing dysfunctional behaviour, a critical further point is that targets do not provide a method. Neither do they provide additional capacity for achieving the improvements sought. Therefore, setting an arbitrary numerical target for response times (or anything else), simply does not change anything about those systems conditions that dictate predictable levels of performance. The system will produce what it’s capable of producing, whether the target is there or not.

Stick people skittles target

The pro-targets assumption seems to be that if response drivers just worked a bit harder then we’d see improved response times. Well put yourself in their position – you’re driving to the incident with blue lights and sirens blaring – does the presence of a target change the distance you have to travel, the road conditions, the weather, your driving ability, the availability of suitable vehicles, the amount of resources on duty, the fact that there’s long term roadworks on one of the main thoroughfares this week?

The target is irrelevant, because it does not provide a method.

Posted in Systems thinking | Tagged , , , , , , , | 3 Comments

Leadership is Not Enough

Much is made of the importance of leadership, and I don’t disagree. However, what’s often overlooked is the importance of system conditions. Deming talked about this when he pointed out most troubles and possibilities for improvement come from the system. Think about it like this…

Imagine yourself as the world’s most inspirational leader. Here you are (in stick person form), trying to carry out your task of standing these skittles upright.

Stick man skittles

Unfortunately, they keep tipping over. This is nothing to do with your leadership ability, but simply because the floor surface is slightly convex. No matter how hard you try, they tip over and you spend your time flitting between them, rebalancing them one-by-one as they fall. The uneven floor is a system problem folks – and Deming says management have the responsibility of addressing system problems. Leadership is not enough.

Stick man boat

Here’s another example. You’re the captain of a ship. Sadly, the ship they put you in charge of has big holes in the hull which keep letting in water. You spend all your time and energy bailing out the water. Your crew work hard for you and you do your best to lead them, but you have no means of repairing the holes. Another system problem. Leadership is not enough.

Stick plantLast one. This plant wants to  reach its full potential, but its roots are restricted by the plant pot, which it has outgrown. You’re expected to tend to it but aren’t allowed to re-pot it. Frustrating huh? Well, that’s another system condition no amount of your outstanding leadership can fix. Your management have the responsibility of improving the system conditions (i.e. providing you with a bigger plant pot) so that you can demonstrate what a great gardener you are. Leadership is not enough.

Of course, this applies at every level and goes all the way to the top. You can lead within the parameters set for you; those further up the food chain can do the same. But until dysfunctional system conditions are addressed by those at the top of the pile:

Leadership is not enough.

Posted in Systems thinking | Tagged , , , , | 6 Comments