
Over the last few weeks, our little friend Stick Child has been doing a really interesting school project about a thing called variation. Not everyone knows about variation. His project is called:
“Understanding Variation (For the Very Young or Pathologically Resistant)”.
Stick Child has learnt some pretty cool stuff during his project, which he thinks might be useful for grown-ups who struggle to use numbers properly when it comes to trying to understand performance information.
Here’s what he’s been up to…

Armed with clip-boards and pencils, Stick Child and his friends have been standing outside their school and counting the number of red cars that drive past on different days. First of all, Stick Child ended up with a nice tally chart like this…

…then he used the daily totals to make an even nicer control chart like the one below:
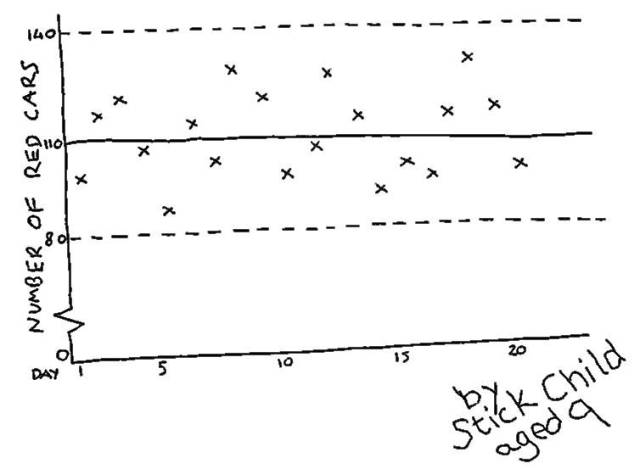
As you can see, there were different amounts of red cars each day. Stick Child’s teacher showed the class where the special dashed lines belong on the chart, and explained that in this case, every ‘X’ between them is completely normal because of this thing called ‘variation’. This means it’s a mistake to assume there’s any meaning behind different individual values, as well as a big waste of time trying to find out why one is different from another. (If you have difficulty sleeping and want to know how the lines are calculated, there is a step-by-step guide in Stick Child’s favourite bedtime book).
Next, Stick Child did some experiments with his chart. First of all, he randomly picked one of the numbers between the lines and called it a target. Then he tried to work out why sometimes the number of red cars hit the target and sometimes it didn’t.
Next, he tried to make the target influence the number of red cars by shouting at the chart and / or the cars as they drove past, but that didn’t work either.
Then, he said he would give 10p to one of his friends if she was able to make the target work. At first this didn’t make any difference, but later his friend said the target had been met. Stick Child looked closely at her chart and discovered that she had altered some of the numbers on it, so he told the teacher and kept his 10p.
Next, Stick Child picked random previous days’ totals on the chart and drew arrows between then to try and work out if the number of red cars was increasing or decreasing. Unfortunately, this just caused confusion because he got a different result every time; he quickly determined that making such binary comparisons was rubbish, so stopped doing it.

Finally, Stick Child’s teacher timed how quickly the children had drawn their charts, then ranked them in a league table. Then she told the children that half of them were below average. None of the children could understand why she would do this, as they had worked very hard on their projects. It made them feel sad.
After a minute, the teacher told them this was actually just part of the lesson and that really she was very pleased they had done their best, because this is what really matters. Stick Child and his friends were glad that this silly way of assessing performance would never actually happen in real life.
What Stick Child Learnt
The project taught Stick Child and his friends lots of useful things. He learnt that there is no point worrying about why the total number of red cars was different on different days – this happens because of that thing called variation. He found out that unless systems conditions change (e.g. due to a road closure), those little ‘X’s will continue to appear anywhere between the dashed lines.
 In addition to this, Stick Child and his friends learnt that targets don’t make any difference to the amount of red cars that drive past his school. This is because variation doesn’t pay any attention to man-made follies, such as numerical targets. He remembered his Dad always says that numerical targets are arbitrary and likely to cause dysfunctional behaviour.
Stick Child also discovered that there is no point drawing arrows between two isolated numbers because it gives the impression of trends that simply do not exist. Finally, he learnt that league tables are a poor way of assessing performance. For his efforts, the teacher sent a nice letter to his parents.
Even though he is only nine, Stick Child knows that control charts do not just apply to red cars or school projects. They can also be used by grown-ups, for things like crime figures, response times, or almost any other set of numbers you might want to learn about. (That’s if the grown-ups really want to learn about these things).
If he understands this, so can you.


Pingback: Stick Child’s School Project | Policing n...
Your stick figure series is outstanding. I especially like this one, because numerical targets are a big thing in education too. I remember seeing a poster once that said something to the effect of “don’t blame the individual, look at the system in which they work.”
Hello and thanks very much!
The poster is right by the way – people are of course essential, but their performance is limited to the parameters the system imposes on them. The system should be geared up to being conducive to good performance, not hinder the workers. Deming talked a lot about this principle.
Anyway, keep enjoying the blog!
Hi Simon,
I recognize that your Stick-Child series are meant as a teaching tool. But, I really believe that education about variation should begin in school as early as possible. Instead of teaching that all problems have one right answer, it’s important we show that there are no absolutes in the real world. There is variation in everything. And, the sooner we understand the nature of variation the better prepared we would be to deal with it throughout our lives.
Best regards,
Shrikant Kalegaonkar
This is fabulous! Thanks for sharing this – and thanks to Fiscalshare who brought me here!
Simon, is this the start of a new career as a children’s book writer and illustrator!
Pingback: Stick Child’s Guide to Systems Thinking | InspGuilfoyle
Pingback: Stick Child’s School Project | Systems thinking
Pingback: Straight Lines | InspGuilfoyle
Pingback: The Weather Man | InspGuilfoyle
Pingback: Pigsaw Blog » Blog Archive » Bookmarks for 3 Apr 2014